HealthPivots DataLab
Maximize access, growth and share in your network and service area with DataLab, the analytics platform from the only vendor with 100% of the most current Medicare Part A and Part B claims data and decades of experience analyzing these data sets.
Get a leg up on your competition
Comprehensive claims data, cost report data, quality data, customizable benchmarks, patient flows between provider types, DRG analyses, detailed trend and ranking information, general inpatient planning models, and much more! DataLab supports all your tactical, strategic, and planning needs.
Exhaustive Data
Access both current and multi-year longitudinal data for every physician, hospital, and post-acute provider in the U.S. Anchor your strategic decisions on concrete, reliable and well-documented data. Arm your outreach program with specific targets and tactics to successfully implement their sales and partnering strategy.

Actionable Insights
From patient flow and referral information to benchmarking tools, you will extract more than just numbers — you will get the actionable insights you need to plan for service levels and maximize access and performance in a rapidly changing marketplace.
Customizable Tools
Our analytics and tools focus on linkages within the health care continuum at granular geographic levels and allow you to define your own custom set of benchmarks within DataLab for various regions and sets of providers.

Look like a rock star to healthcare partners
Liz Fowler, President and CEO, Hospice of the BluegrassNot only do we use the HealthPivots data annually and quarterly to help us plan, but we also use it on a regular basis as we talk to our healthcare partners. Before any meeting with a health system or hospital, I dig around in DataLab so that I have information and know what to talk about when I get there – how we can help them, what goals we should be working towards, etc. It makes me look like a rock star and helps to drive the conversation to goals that are good for us and for them.

E-mail reports and graphics directly to others
Amy Kemper, CPA, MBA, VP of Finance and Analytics, Pure HealthcareDataLab is my everyday tool for statistics. The new format is quick, convenient and user friendly. I especially love being able to e-mail reports and graphics directly to my end users. Whether it be information on referral sources, competitors or our own affiliates, reports from DataLab makes our analytics team look great!
Easily accessible data your team can rely on
-
Data updated quarterly
HealthPivots has access to the most complete and up-to-date quarterly and annual CMS Part A and Part B data.
-
Video tutorials
Live training through the onboarding process is complimented by access to video tutorials.
-
Web-based platform
HealthPivots DataLab runs on all browsers, and on desktop, tablet, and mobile devices.
Real humans ready to help
HealthPivots is ready to answer your questions! A member of our team will respond with prompt and personalized customer service.

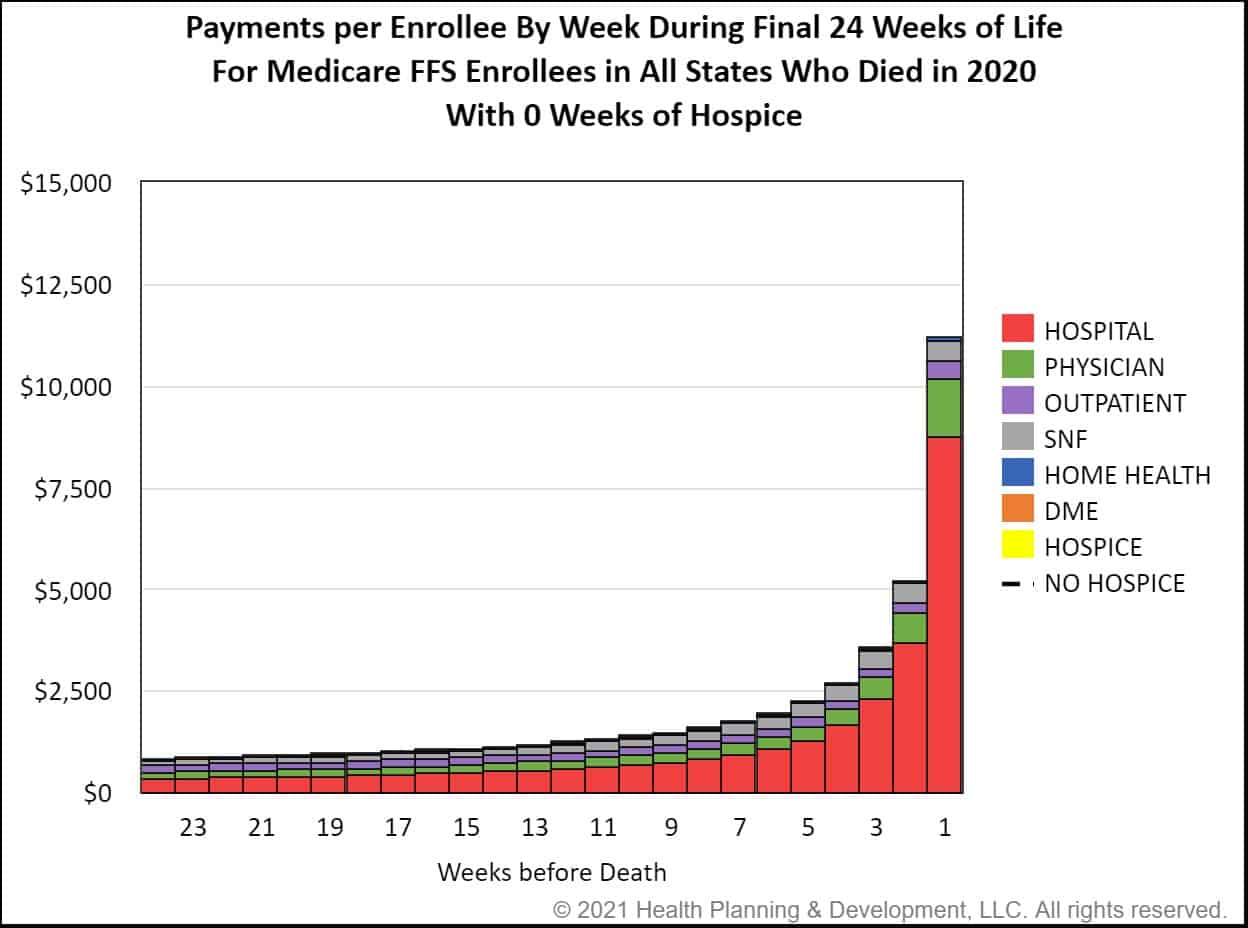
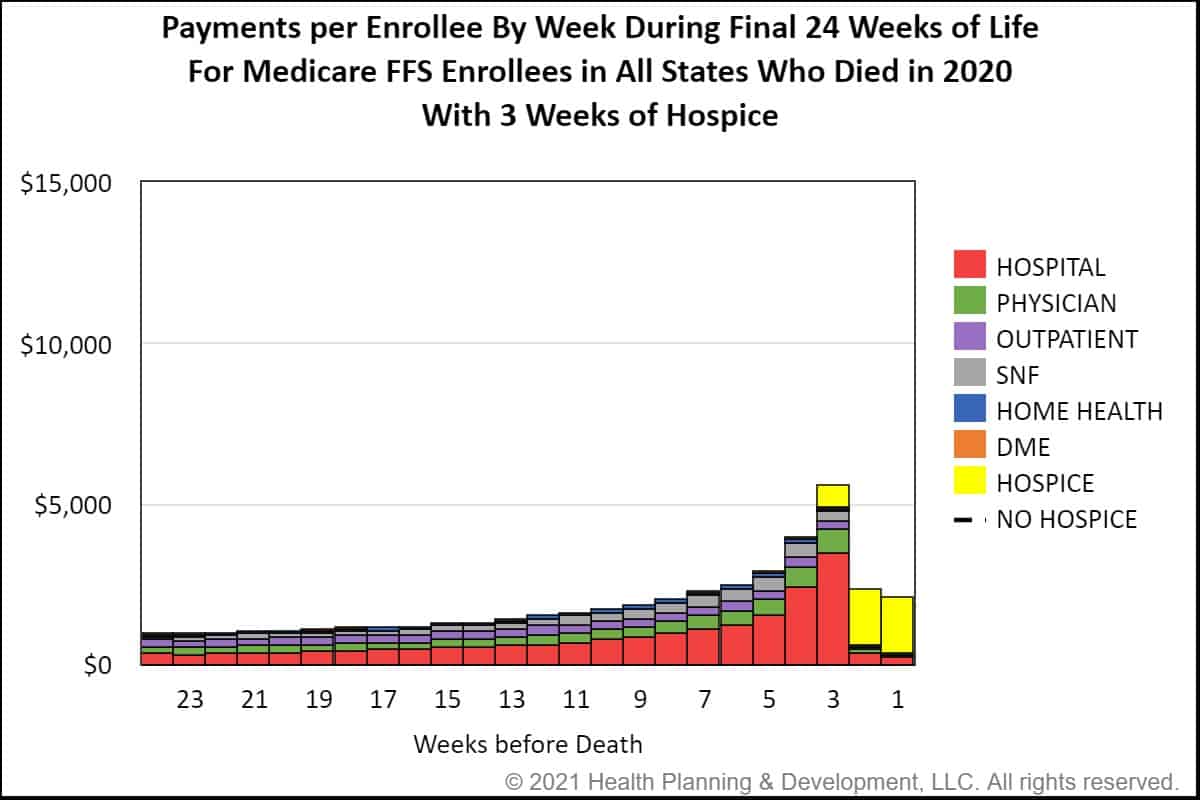
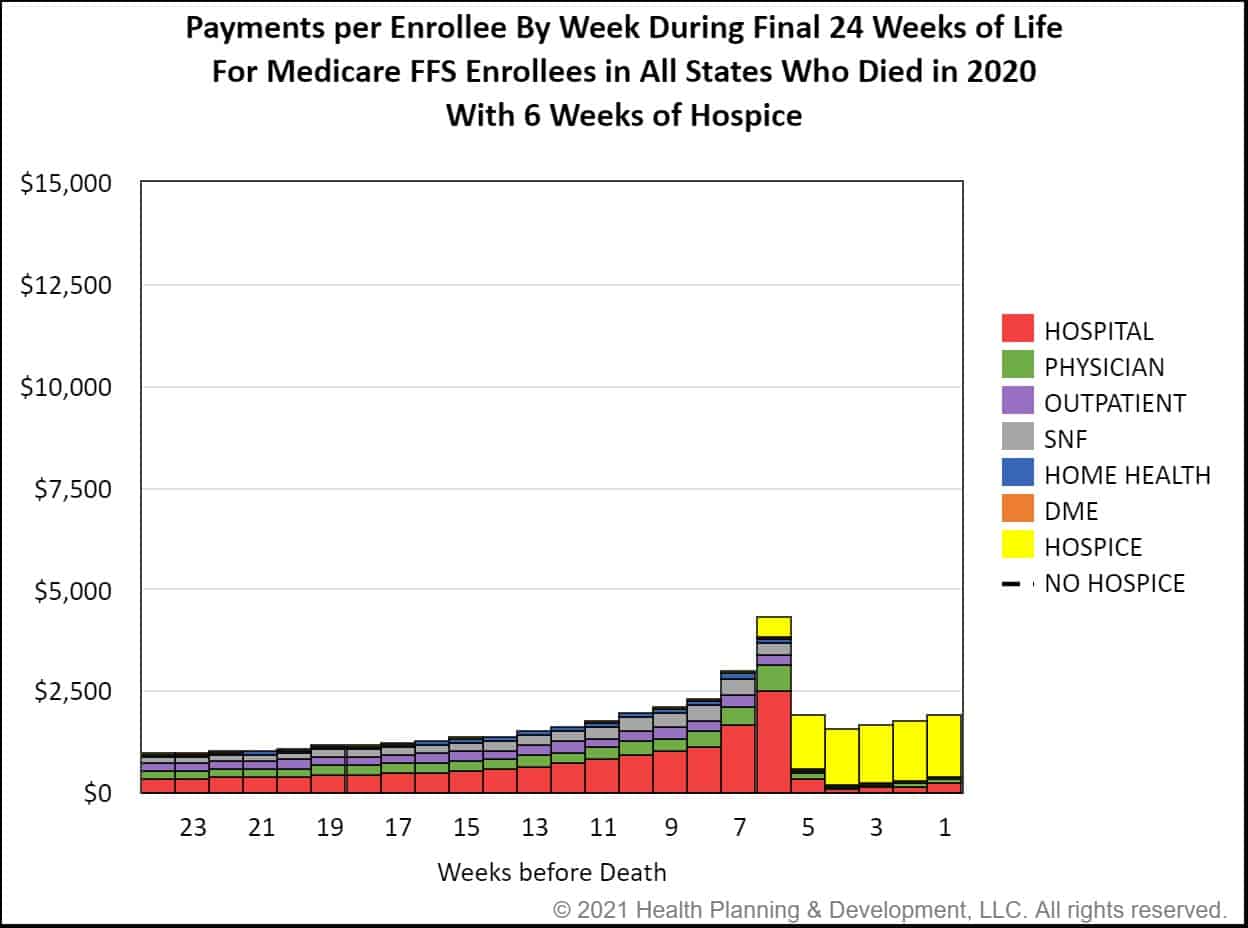
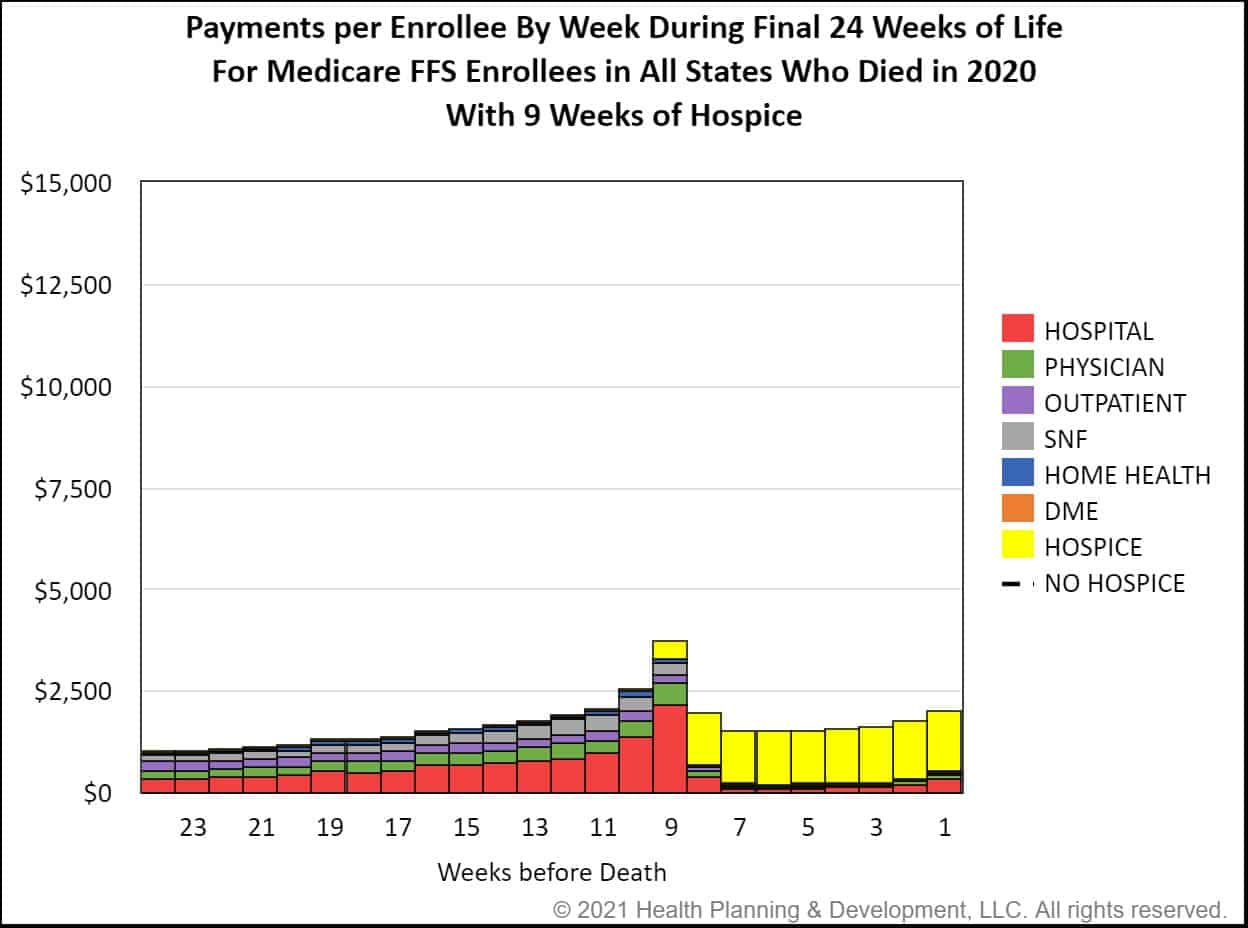
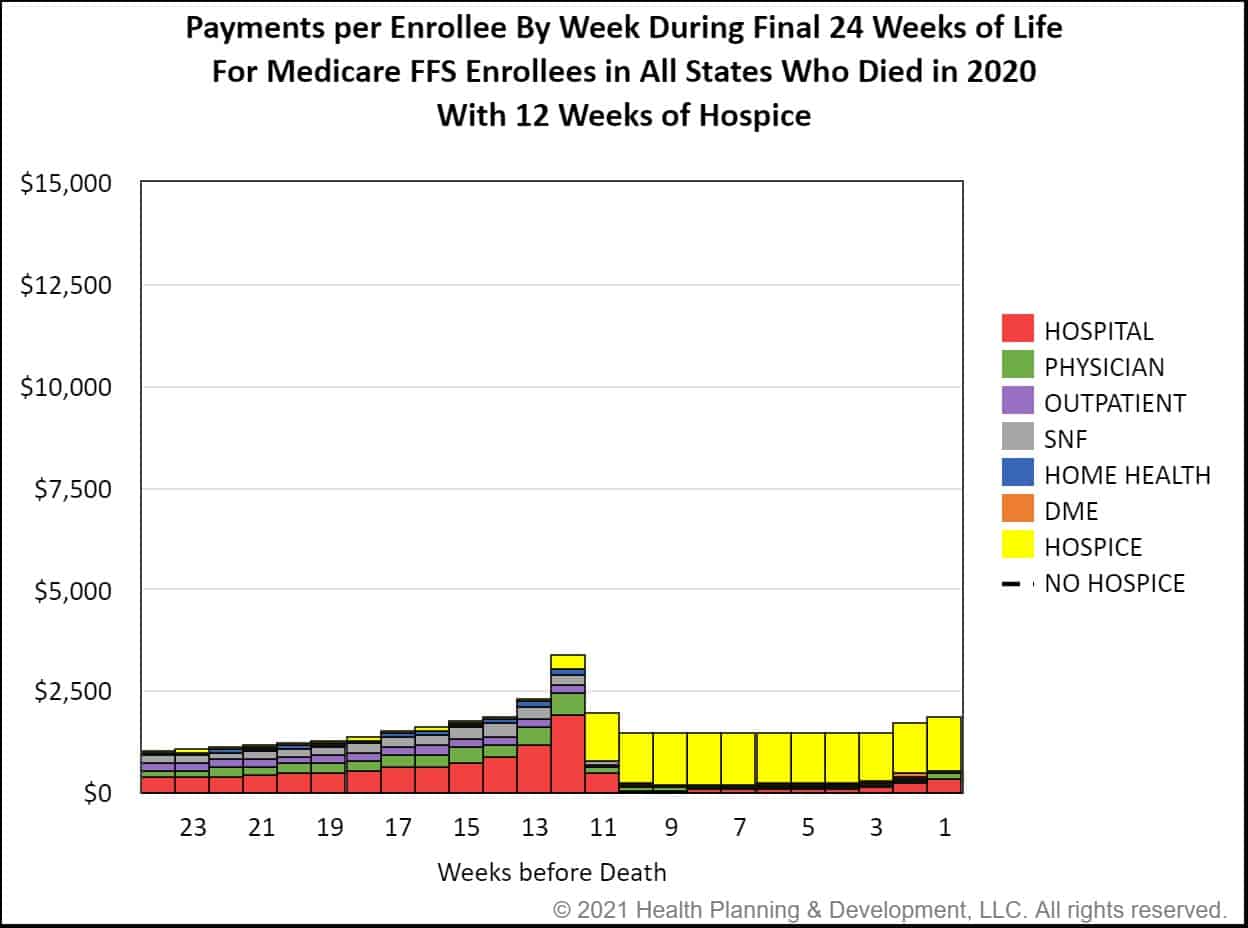
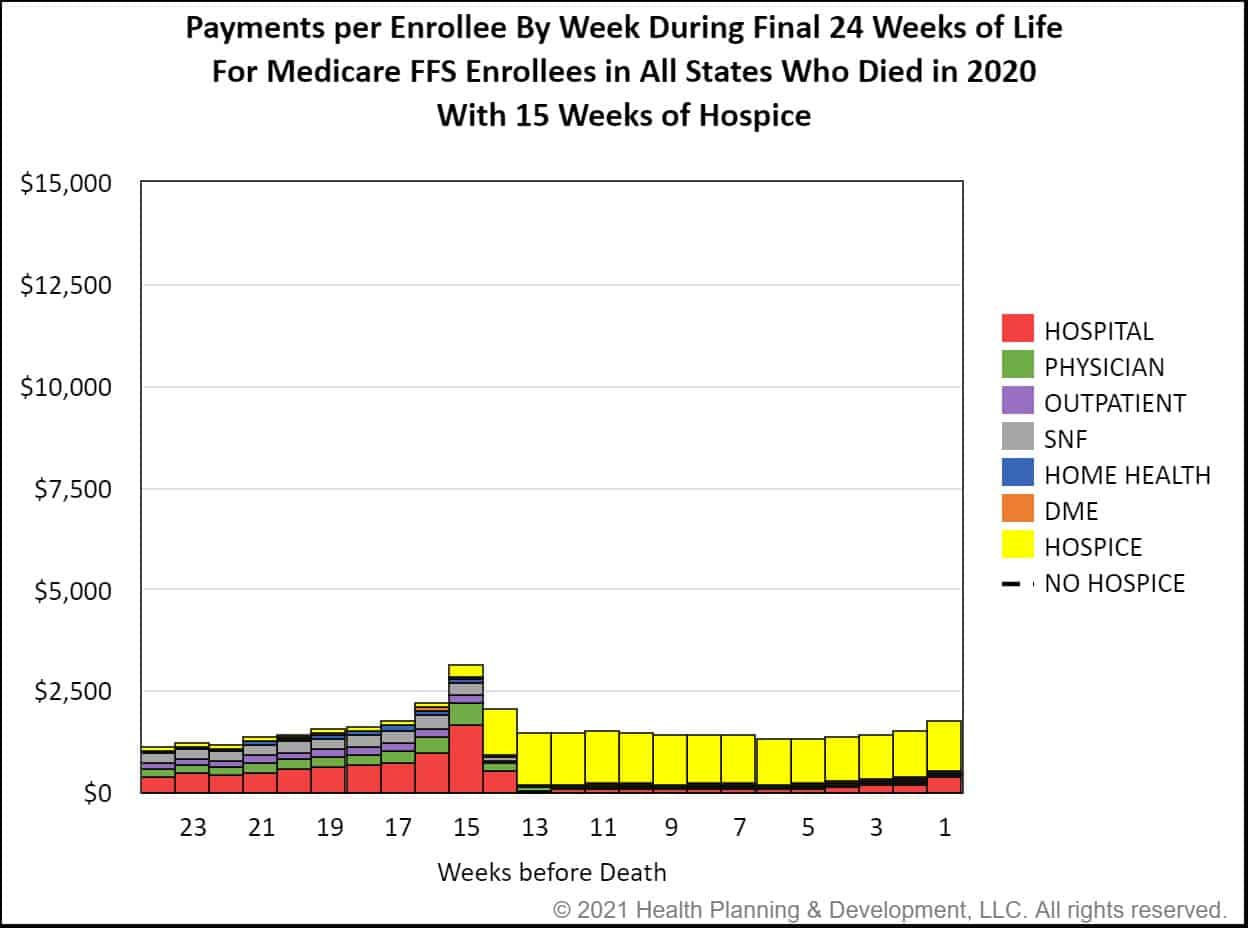
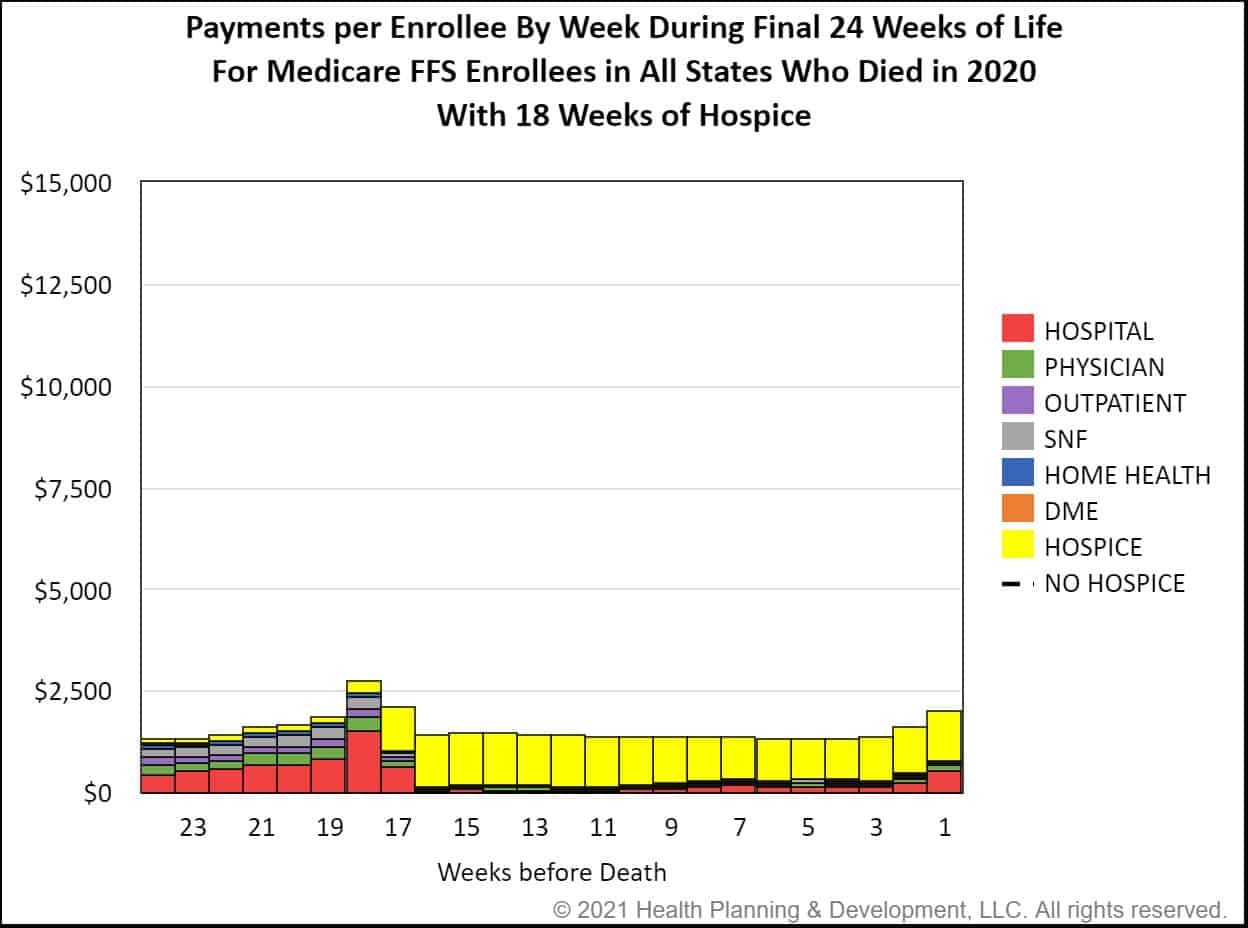
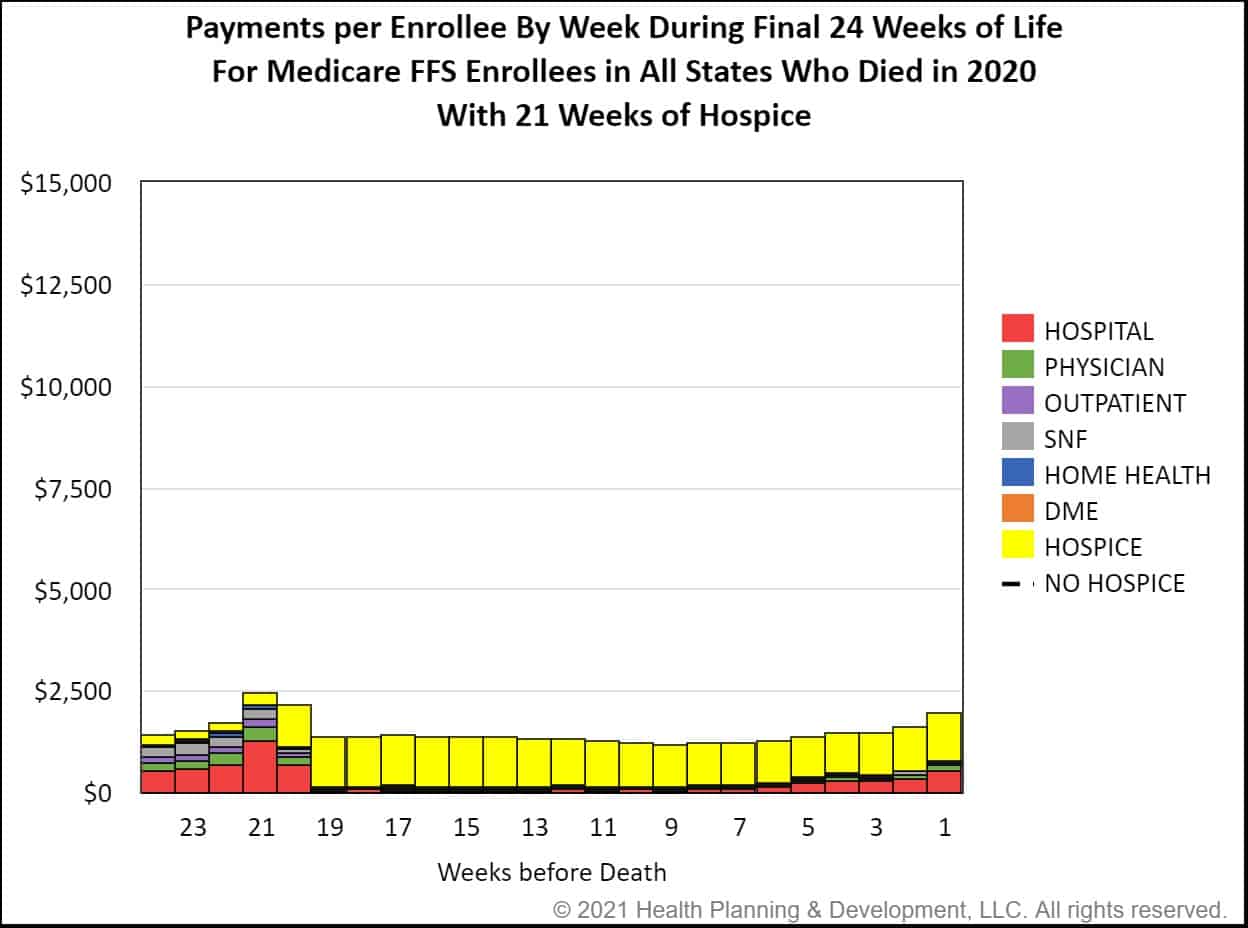
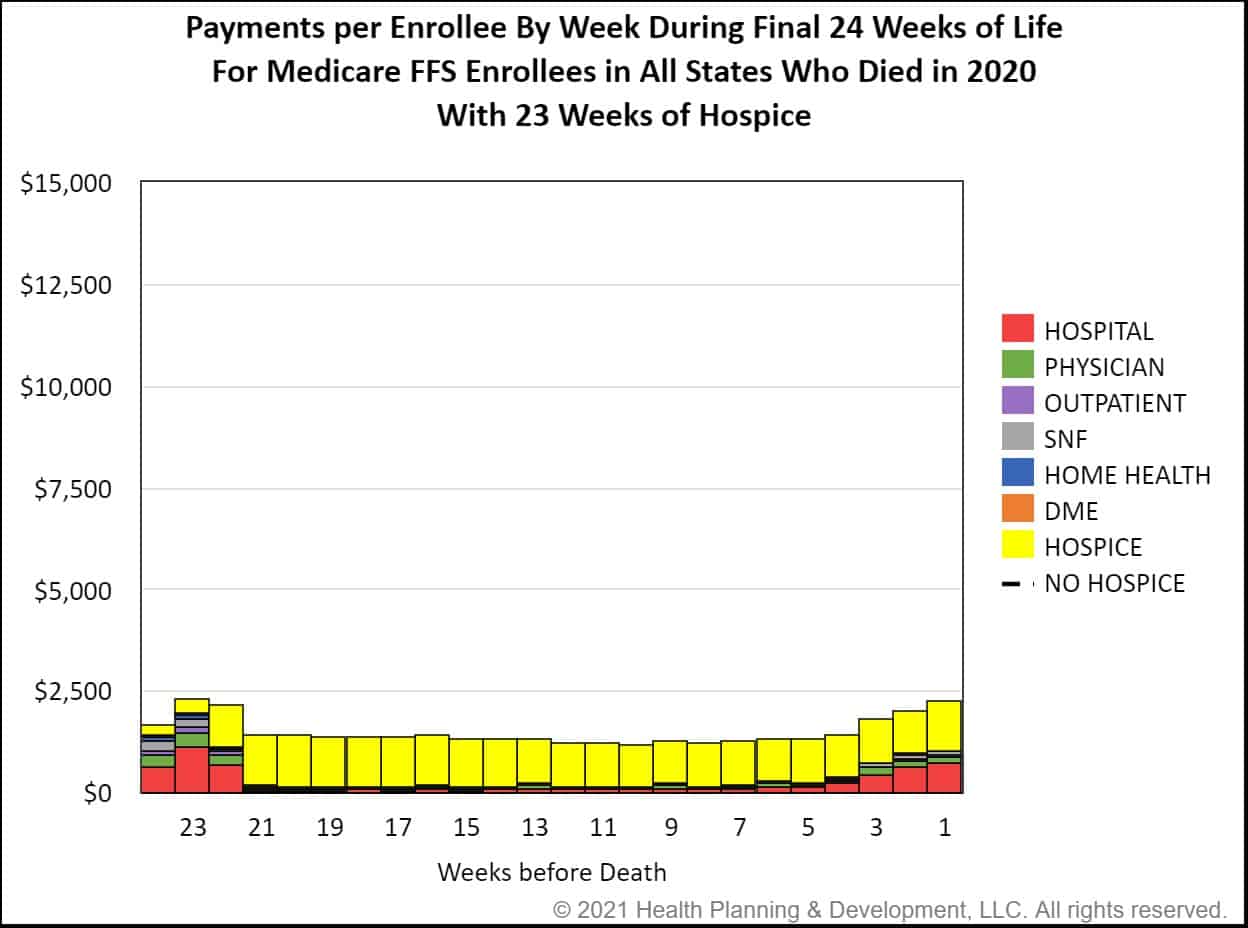
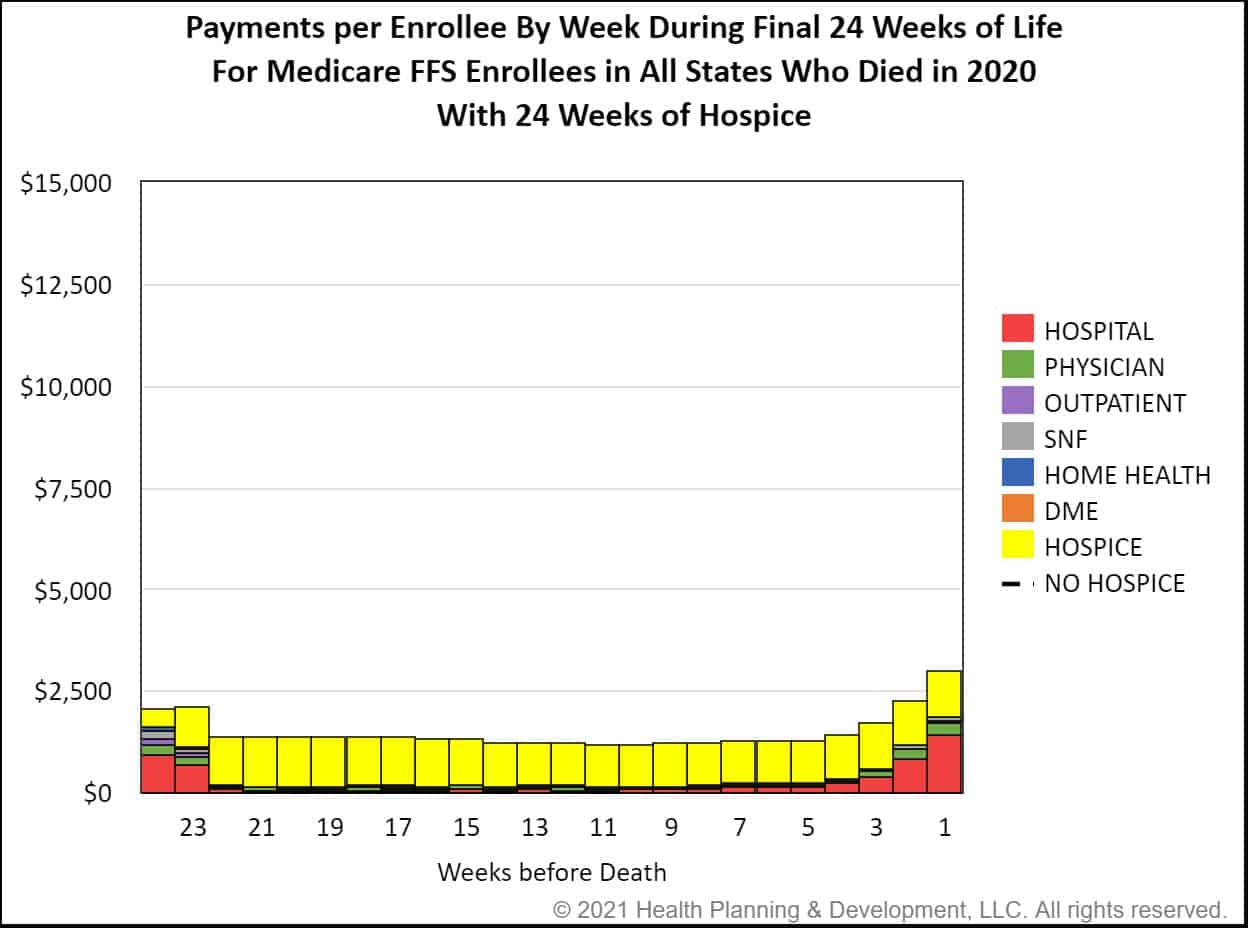
Medicare end-of-life-payments by week
Overall healthcare spending at the end of life and healthcare spending by sector are both heavily influenced by the number of weeks of hospice care received by Medicare FFS enrollees. State-level spending information is available in HealthPivots DataLab.
-
60+
Interactive DataLab Tools with multiple reports in each tool
-
Unlimited
Number of users permitted for each subscribing client
-
Outreach
Email analytics directly from DataLab to a colleague or network partner
HealthPivots DataLab FAQs
HealthPivots DataLab analytics include annual and quarterly Medicare Part A and Part B claims data available from the CMS’ Chronic Conditions Data Warehouse (CCW) Virtual Research Data Center (VRDC). HealthPivots accesses data from Hospital, Hospice, SNF, Outpatient, Home Health, Hospice and DME claims as well as Medicare Part D, Medicare Advantage. Other data sources include Medicare Cost Reports, and data from CMS Quality Reporting Programs and Quality Initiatives.
HealthPivots DataLab answers a wide variety of questions. The most common questions clients can answer with HealthPivots DataLab include: Are we meeting the needs of our service area and referral sources? Which providers do we need to partner with in order to meet the needs of our service area? What are the untapped referral sources? How do we compare to similar providers in our area or in our state? How has our market share and that of our competitors changed over the last ten years? What would post-acute care look like if certain factors were adjusted? Are there opportunities to expand our service area? Are patients’ post-acute needs being met from within our integrated health system?
We’re here to help! Our staff are happy to provide training to ensure you know how to find the most relevant reports. If you have an idea for a report that does not exist, we welcome this client input and may add your request to our analytics development queue. In fact, most of our analytics have grown from custom-built solutions over the last 10+ years.
HealthPivots DataLab is competitively priced based on the size of your agency.
Most of our contract options include the right to cancel with 30 days notice.
Custom-built solutions for:
-
Hospice
HospiceCompare performance against competitors and determine if the needs of your service are and referral sources are being met.
-
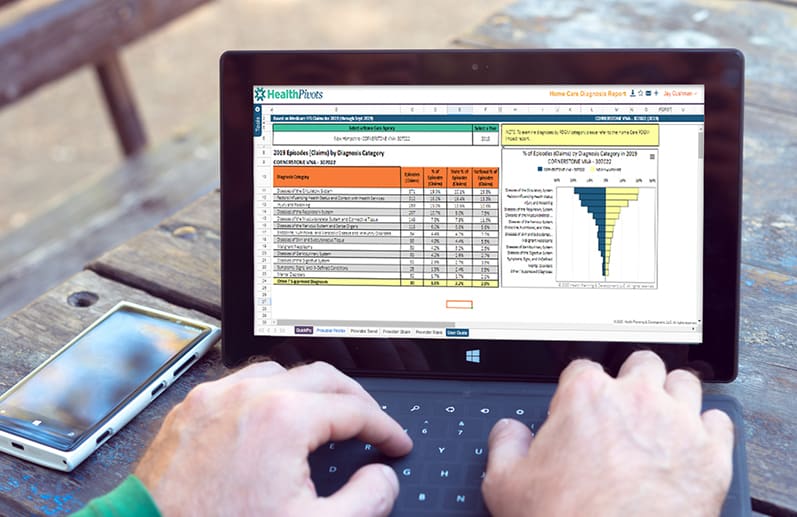
Home Care
Home CareCharacterize counties and providers and improve the effectiveness and flow of post-acute care.
-
Accountable Care
Accountable CareEvaluate or grow your REACH or MSSP ACO program and assess beneficiary alignment for different groups.
-
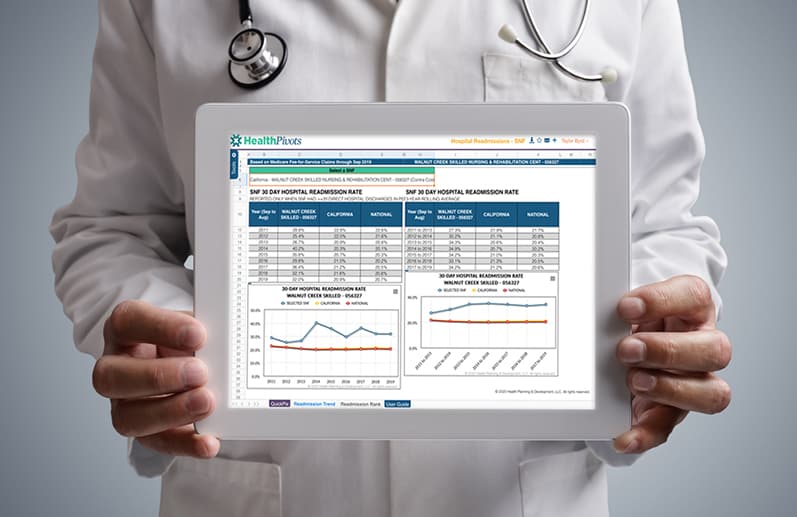
Skilled Nursing
Skilled NursingDetermine referral, utilization, readmission and discharge information across facilities and counties.
-
Hospitals
HospitalsExamine detailed readmissions and performance data of competitors and post-acute care partners.
Get actionable insights today!
Learn about the quantitative market dynamics in your service area through a virtual consultation with HealthPivots staff.