Changes in Use Rates and Payments for Services Covered by Medicare
At HealthPivots our business intelligence data includes all the available Medicare Limited Data Sets going back to 2009 (with home care data since 2005 and hospice data going back as far as 2000). These data sets contain the full range of services covered under Medicare Part A and Part B. Our analyses provide HealthPivots and our clients with a comprehensive picture of Medicare utilization and payments for fee-for-service enrollees (enrollees in Original Medicare), who comprise about 70 percent of all Medicare beneficiaries.
In 2009, Medicare paid an average of about $8,800 per fee-for-service beneficiary for covered services (excluding outpatient prescription drugs). Payments for Hospital Inpatient and Hospital Outpatient services combined for $4,630 of this total — just over half.
Medicare Payments per Enrollee in Original Medicare in 2009 and 2015
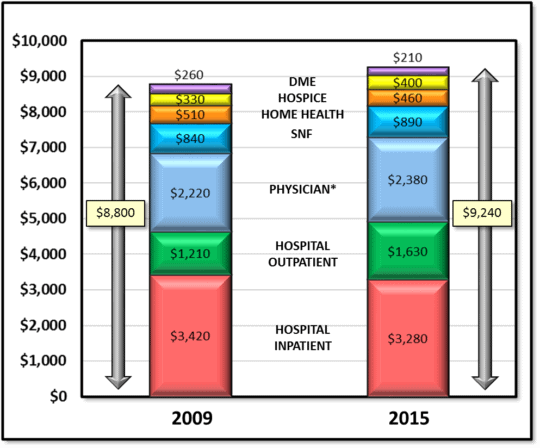
* Includes physician services and other professional services billed under Medicare Part B
By 2015, payments per enrollee had increased to $9,240. Payments for Hospital Inpatient and Hospital Outpatient services remained approximately half of the total, though the balance of Outpatient and Inpatient payments changed. Payments to physicians and other suppliers under Medicare Part B remained at about 25% of the total. Payments to skilled nursing facilities remained at about 9.5% of the total. Payments for durable medical equipment fell sharply from 3.0% of the total to 2.3% between 2009 and 2015. Payments for home health also fell as a percent of the total. However, payments for hospice service rose from 3.8% to 4.3% of the total for these seven services.
Payments for Covered Services as Percent of Total in 2009 vs. 2015
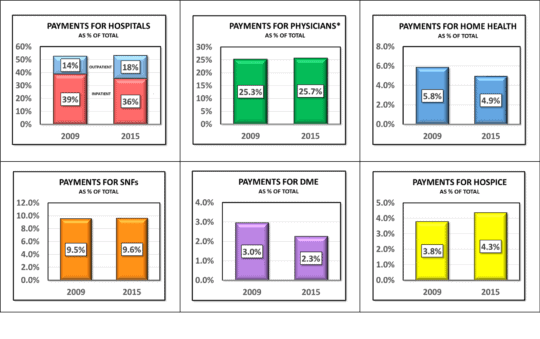
These changes in the payment percentages were driven by changes in both use rates and payment policies.
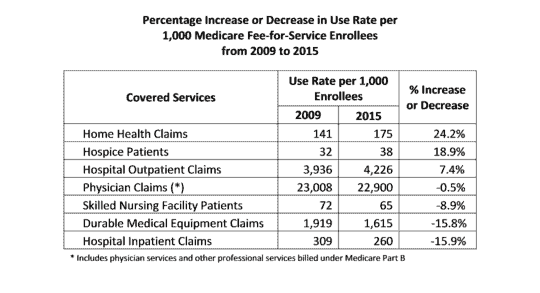
Hospital inpatient use rates decreased, while hospital outpatient use rates increased from 2009 through 2015. This is reflected in the shift in payments from inpatient to outpatient services. Among Medicare fee-for-service enrollees, the use rate for hospital inpatient services fell from 309 claims per 1,000 enrollees to 260 claims, from 2009 through 2015 — a decrease of 16%. The use of hospital outpatient services per 1,000 enrollees rose by 7.4% during the same period.
Payments for home health care fell as a percentage of total payments, as reduction in payment rates under the Patient Protection and Affordable Care Act (PPACA) of 2010 offset a 24% increase in use rate for home health services.
The decline in payments for durable medical equipment was a result of both a decrease in prices, as competitive bidding was introduced after 2009, and by a decrease in use rates of almost 16%.
Payments for hospice care have risen largely because of continuing increases in use rate.
The following chart depicts the percentages changes in use rate per Medicare enrollee since 2009.
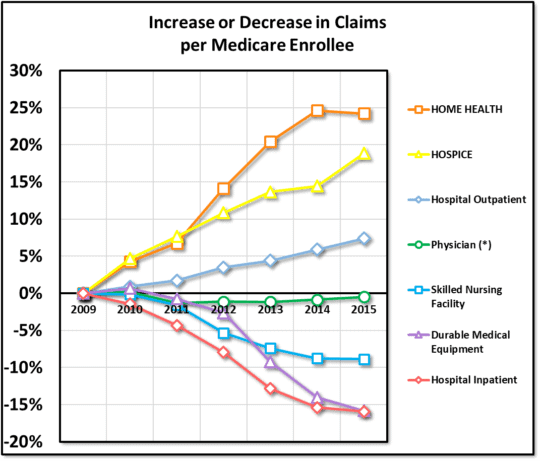
Going forward, the use of and payments for these covered services will be influenced by innovations in Medicare service delivery and payment policy. These innovations will include:
- Continuation of the Hospital Readmissions Reduction Program (HRRP) (since 2013)
- Implementation of the Skilled Nursing Facility Value-Based Purchasing Program (SNFVBP) (starts in FY2019)
- The Home Health Value-Based Purchasing (HHVBP) Model – Selected States (since 2016)
- The Bundled Payment for Care Improvement (BPCI) program
- Shared Savings Program
- Comprehensive Care for Joint Replacement Model
- Oncology Care Model
These innovations can be expected to reinforce the trends toward home-based and outpatient services and away from hospital inpatient services.