State Home Care Profile
Learn about the home care market throughout your state
Printed book with longitudinal CMS data over a 13-year period
HealthPivots’ State Home Care Profile contains detailed market data for every county in your state based on Medicare claims from 2007 through 2019.
County level home care market data
Data for each county
The State Home Care Profile provides detailed information about home care reach and access in each county, the major home care agencies that serve these counties, and additional data around the home care visits and patient population over time.

State and national data
Every State Home Care Profile includes national and state home care information to contextualize the local-level data.

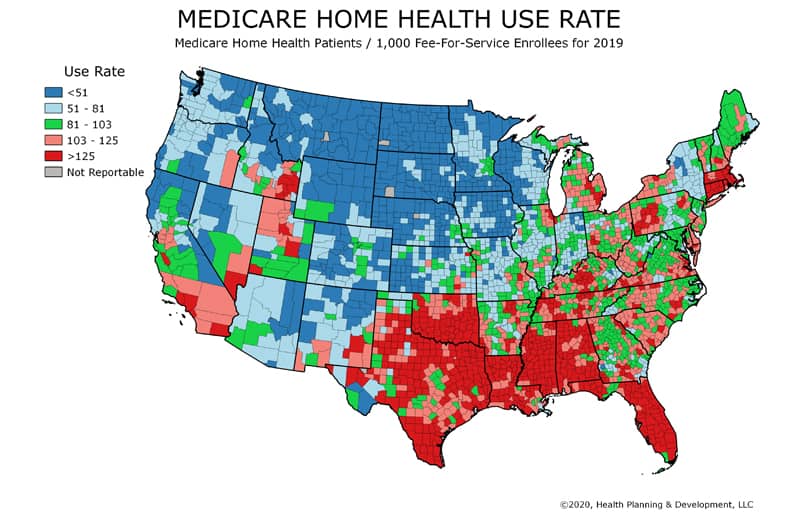
National maps
Variation in home health user rate and home health visits per episode are illustrated through the inclusion of national maps that focus down to both the state and county level.
Order your State Home Care Profile today
Printed State Home Care Profiles are based on the most recent annual CMS claims.